
. Advertisement .
..3..
. Advertisement .
..4..
Pandas is known for its multi-functionality. In this article, we will show you the simplest and most complete way to Create a Correlation Matrix using Pandas. Without wasting your time, let’s jump in!
What is the Correlation Matrix ?
Correlation matrix is used to test the relationship between variables at the same time. When implementing the matrix, users will easily see the table containing the correlation coefficients between the variables (strength, positive or negative correlations). Users can completely create correlation matrix using Pandas or Numpy in Python.
How to Create a Correlation Matrix using Pandas
To generate the correlation matrix using Pandas, we will use the dataframe.corr() function. The dataframe.corr() function will return the results for each pair of variables and show the correlation between them. If the data is not numeric, it will be ignored.
Syntax:
DataFrame.corr (self, method = 'pearson', min_periods = 1)
In the corr() method usually default to using method=Pearson to calculate the correlation coefficient. In addition, you can also replace it with other methods such as Kendall and spearman. For more details, you can learn more here.
Specific steps to create correlation matrix:
- Input data
- Convert data to dataframe (using Pandas)
- Creating correlation matrix using Pandas
Example
We are having data about 3 variables as follows:
| A | B | C |
| 45 | 38 | 10 |
| 37 | 31 | 15 |
| 42 | 26 | 17 |
| 35 | 28 | 21 |
| 39 | 33 | 12 |
After entering enough information of the data, the next step we will convert it to Dataframe type.
Enter the following code:
import pandas as pd
data = {'A': [45,37,42,35,39],
        'B': [38,31,26,28,33],
        'C': [10,15,17,21,12]
        }
df = pd.DataFrame(data,columns=['A','B','C'])
print (df)
Finally, to create the matrix, enter the following syntax:
import pandas as pd
data = {'A': [45,37,42,35,39],
'B': [38,31,26,28,33],
'C': [10,15,17,21,12]
}
df = pd.DataFrame(data,columns=['A','B','C'])
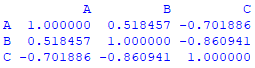
corrMatrix = df.corr()
print (corrMatrix)
After running the above command, you will see output like this:
......... ADVERTISEMENT .........
..8..
Also, if you want to display the matrix more intuitively. There are two preset packages, seaborn and matplotlib, that will support this.
To be able to run, you need to install it first. Use this command:
import seaborn as sn
import matplotlib.pyplot as plt
Then add this code to the program that generates the matrix
sn.heatmap(corrMatrix, annot=True)
plt.show()
The full program would be:
import pandas as pd
import seaborn as sn
import matplotlib.pyplot as plt
data = {'A': [45,37,42,35,39],
         'B': [38,31,26,28,33],
         'C': [10,15,17,21,12]
         }
df = pd.DataFrame(data,columns=['A','B','C'])
corrMatrix = df.corr()
sn.heatmap(corrMatrix, annot=True)
plt.show()
The return results are as follows:
......... ADVERTISEMENT .........
..8..

If you use the Matplotlib.pyplot.matshow() method, here is an example:
import pandas as pd
import matplotlib.pyplot as plt
employees_df = pd.DataFrame({
    'Name': ["Jonathan", "Will", "Michael", "Liva", "Sia", "Alice"],
    'Age': [20, 22, 29, 20, 20, 21],
    'Weight(KG)': [65, 75, 80, 60, 63, 70],
    'Height(meters)': [1.6, 1.7, 1.85, 1.69, 1.8, 1.75],
    'Salary($)': [3200, 3500, 4000, 2090, 2500, 3600]
})
corr_df = employees_df.corr(method='pearson')
plt.matshow(corr_df)
plt.show()
Output:
......... ADVERTISEMENT .........
..8..

So you have completed the steps to be able to create a correlation matrix using Pandas
Conclusion
We hope you enjoyed our article about discovering the answer for your lesson “Create a Correlation Matrix using Pandas”. If you have any questions or concerns, please feel free to leave a comment. We are always excited when our posts can provide useful information!
Leave a comment